What the document says
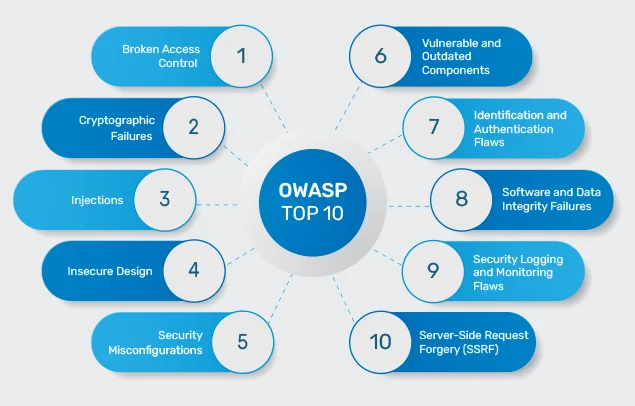
OWASP originally released the Top 10:2021 on 24 September 2021, with a version 1.1 update on 13 July 2025 that the notice page records only as a version change, without itemising its content. The list ranks A01: Broken Access Control first, up from fifth in the 2017 edition. OWASP's own figures for the category: 34 CWEs mapped to it, an average incidence rate of 3.81 percent across contributed test data, and 94 percent of tested applications showing at least one weakness in the category, drawn from 318,487 recorded occurrences and 19,013 mapped CVEs. The introduction explains the ranking method: eight of the ten categories come from data contributed by application-security testing firms and bug-bounty platforms, two come from an industry practitioner survey, and the underlying dataset spans more than 500,000 applications and roughly 400 CWEs.
Confidence and limits
These are figures OWASP publishes about its own project, so they reliably describe what the contributed data and survey showed, not an independently audited measurement of web application risk generally. OWASP's introduction states this limit itself: the results are primarily limited to what testers can check for in an automated fashion, and the picture looks backward and may miss emerging trends. A ranking built from roughly a dozen contributing organisations' testing tools also reflects what those tools look for, which is not the same as every access-control failure that exists in production.
Why it mattered
Moving broken access control to first place changed which category security teams and vendors emphasised in training and tooling, because the list functions as a widely cited prioritisation signal well beyond OWASP's own contributor base. The category covers a broad range of failures, from missing authorisation checks to insecure handling of object references, so a high ranking does not point to one specific fix. Treating the rank as a single finding, rather than a category header, has led some teams to look for one control to add, rather than an authorisation model to review end to end.
Defensive takeaway
Use the list to prioritise what you test for, not as a substitute for testing your own application's authorisation logic; the incidence rate describes contributed test findings, not your specific deployment.
- Do we test authorisation on every state-changing request, not only the ones behind a login page?
- Would our current testing tools actually surface the kinds of weaknesses OWASP maps into this category?
- Are we treating access-control review as a completed task, or as an ongoing check as features change?
A ranking answers what testers found across many organisations' applications, not what is true of any single one. Reading it as a starting checklist for a specific access-control review is a safer use of the data than reading it as a scorecard that already shows where an application stands.
Use the ranking to prioritise what you test for, and confirm your own authorisation logic directly rather than relying on the rank alone.
OWASP's own release notice, category page and introduction establish the release date, the category's statistics and the contributed-data-plus-survey method. They also state the method's own limits, which this account repeats rather than treating the ranking as a comprehensive risk census.
Sources & reading trail
Gives the A01 statistics: 34 mapped CWEs, 94 percent of tested applications affected, and a 3.81 percent average incidence rate.
standards-body · Source published: 24 September 2021 · Retrieved: 16 September 2026
States the original release date of 24 September 2021 and records the 13 July 2025 version 1.1 update.
standards-body · Source published: Not established · Retrieved: 16 September 2026
Describes the contributed-data-plus-survey methodology, contributor scale and the stated limits of testing-derived data.
standards-body · Source published: Not established · Retrieved: 16 September 2026
Official records establish the facts; confidence labels and defensive takeaways are Patch & Proof editorial analysis. This retrospective draft does not imply the site published on the event date.